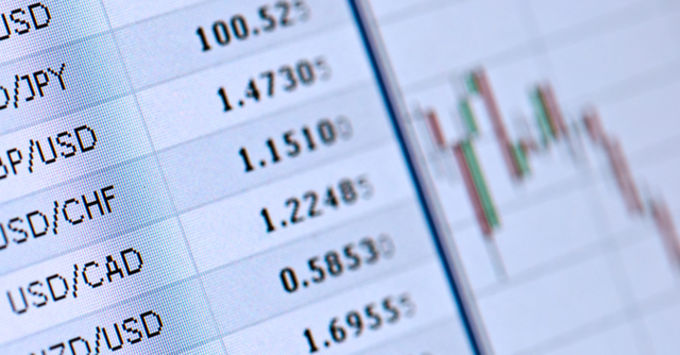

The first price chart I ever opened looked like a heart monitor attached to a patient nobody was checking on. Green bars, red bars, a couple of lines somebody had drawn and forgotten, and a number in the corner that kept twitching every second. I looked at it for maybe ten minutes, decided the market was going up, and clicked buy. The trade taught me plenty, mostly about how fast money leaves an account when you have no idea what you are looking at.
Years later I still think that moment describes the problem most beginners run into. A chart is not confusing because it is complicated. It is confusing because nobody ever explained what the picture is made of. That gap, between seeing a chart and reading one, is where the Academy inside Xcelerate Trade puts its first lessons, and I think that ordering is correct.
What follows is the explanation I wish someone had given me on day one. Plain language, in the order the pieces actually matter.
What a trading chart is recording
Before candles, before indicators, before anybody says the word “trend”, it helps to know what you are staring at. A trading chart is a record of completed transactions. Every point on it exists because a buyer and a seller agreed on a price at a specific moment in time.
Price runs up the vertical axis. Time runs along the horizontal axis. Everything else you will ever add to a chart sits on top of those two things.
The interesting part is what the record implies about people. When price climbs quickly, buyers were willing to pay more and more just to get filled. When it drops in a straight line, sellers were accepting less and less just to get out. Read properly, a chart is a history of urgency.
The Academy hammers this early. Treat the chart as a prediction machine and you will spend years hunting for the magic setting. Treat it as a record of behaviour and you start asking better questions, like who was in a hurry here, and what made them stop.
The right side of the screen is empty for a reason
It took me a couple of painful months to properly absorb this one. Everything on the left of your screen has already happened. The right side is blank and stays blank until reality fills it in.
Written down it sounds obvious. In practice, most beginner errors trace back to forgetting it. We draw a line, extend it forward, and start treating the extension as a fact instead of a guess.
Why candlestick charts became the standard
There are three chart types you will run into, and each one hides something different. A line chart connects closing prices, which gives you a clean shape but throws away everything that happened between those closes. A bar chart keeps the open, high, low and close. A candlestick chart keeps the same four values and makes them readable at a glance.
Candles won the popularity contest for a practical reason. Your eye picks up a filled body faster than it picks up a thin tick on the side of a bar. When you are scanning forty instruments before the open, that difference in speed adds up.
Reading the body and the wicks without turning it into astrology
The body of a candle runs from the open to the close. The thin lines above and below it, the wicks, mark the highest and lowest price traded during that period. Colour tells you direction, though which colour means what depends on your platform settings.
A long body with barely any wicks says one side controlled the whole session. A small body with a long upper wick says buyers pushed price up and then got shoved back before the close. That second one is a rejection, and it tends to show up at a level other people were watching too.
Now the trap. There are dozens of named candlestick patterns, and beginners memorise all of them before understanding any of them. I did this for months. I could spot a hanging man from across the room and still lose money, because I was pattern spotting instead of reading context.
What helped was cutting it down to one question per candle. Who was in control by the close, and did they meet resistance getting there? Answer that candle by candle and the fancy names stop mattering.
Starting wide and working your way down
If one habit separates people who read charts well from people who only look at them, it is direction of travel. Good readers start on a high timeframe and move down. Everybody else opens the five minute chart first and then wonders why nothing makes sense.
A weekly candle compresses a whole week of arguments into one shape. A five minute candle compresses three hundred seconds of noise. Both are honest, they just answer different questions.
The Academy inside Xcelerate.Trade teaches this as a sequence rather than a preference. Weekly or daily first, to see where price sits in its broader range. Then four hour or one hour for the current swing, and only then the timeframe you actually execute on.
The timeframe you pick to justify a trade you already wanted
This failure is sneaky and I still catch myself doing it. You get an idea, the chart in front of you refuses to support it, so you switch timeframes until you find one that does. On fifteen minutes it looks like a bounce. On the daily it is a small pause inside a downtrend that has been grinding for six weeks.
The fix is dull and it works. Decide your timeframe hierarchy before you look at anything, and write it down where you can see it. Higher timeframe for bias, middle for structure, lower for entry, and no rewriting the rules halfway through.
Market structure, the layer beginners skip
Once you can read a single candle and you have settled your timeframes, the next layer is market structure. This is the skeleton of the chart, and it does more work than every indicator combined.
An uptrend is a run of higher highs and higher lows. A downtrend is lower highs and lower lows. A range is neither, which describes the market most of the time.
That last sentence deserves more attention than it usually gets. Markets spend far more hours drifting sideways than they spend trending cleanly. Build a method that assumes a trend and you will force trades through every long stretch when there is nothing to trend with.
Marking swings without burying the screen in lines
Find the obvious swing highs and swing lows, the turning points a stranger looking over your shoulder would also point at, and mark those. If you have to squint to decide whether something counts as a swing point, it probably does not.
When price prints a higher high after a run of lower highs, the character of the move changed. It might be a real reversal or it might be a squeeze that dies in two days, but something shifted and it deserves your attention. Traders call this a break of structure, and it is one of the few concepts I would call essential.
My charts improved a lot the year I started deleting lines instead of adding them. Three or four meaningful levels beat twenty speculative ones. A chart buried in drawings usually belongs to somebody who has not decided what matters yet.
Support and resistance work as zones, not surgical lines
Support and resistance get taught badly almost everywhere. Somebody draws a one pixel line, price misses it by a fraction, and the conclusion is that the whole concept is broken.
Price does not respect exact numbers, because the orders sitting around a level are spread across a band. So think in zones. A support zone forty points wide on an index is perfectly normal and does not mean your analysis is sloppy.
Where do you put them? Areas where price reversed more than once, where a strong move started, or where a gap was left behind. Round numbers matter as well, more than they logically should, because people place orders at round numbers.
Old resistance often turns into support once price breaks above it. Often, not always, and the distance between those two words has cost a lot of accounts a lot of money. Treat it as a tendency worth watching rather than a rule worth betting on.
Volume, the second opinion nobody asks for
Volume tells you how much participation stood behind a move. A breakout carried by heavy volume means real money committed to the level. A breakout on thin volume means a handful of participants pushed price into empty space, and empty space has a habit of giving the level back.
The comparison that matters is relative. Two million shares means nothing by itself. Two million shares on an instrument that normally trades four hundred thousand in the same period means something happened worth investigating.
On crypto and forex the volume data comes with caveats, given how those markets are structured, so I treat it as supporting evidence rather than proof. On indices and equities it carries more weight. Either way it belongs in the reading, after structure and before any indicator.
What indicators are good for
Every indicator you will ever load is calculated from price and volume. Nothing inside that box contains information the chart does not already hold, which is the part most beginners find annoying to hear.
That does not make indicators useless. It makes them a way of summarising something your eye measures badly. A twenty period moving average tells you the average closing price of the last twenty periods, and no, you cannot eyeball that.
The mistake is treating a summary as a signal. A relative strength reading above seventy does not mean sell. In a strong trend, momentum readings stay stretched for weeks while price keeps climbing, and the people who shorted every high reading have the account statements to show for it.
Two indicators, maybe three, each with a reason
My working rule is that every indicator on the chart has to answer a question I asked out loud. A moving average answers where the middle of recent price sits. A momentum oscillator answers whether the current push is weaker than the last one. If I cannot state the question, the indicator comes off the chart.
The payoff is speed. A clean chart reads in fifteen seconds. A chart with eight overlays takes two minutes and usually produces a worse decision, because among eight overlays there is always one agreeing with whatever you already wanted to do.
Your time horizon changes what the chart means
Two people can open the identical chart and correctly reach opposite conclusions. That sounds like a contradiction until you notice they are answering different questions.
Someone building a position over five years cares about the monthly picture, the depth of past drawdowns, and whether the company or the asset survives a bad decade. Someone holding for four hours cares about this morning’s range, the session open, and the nearest level overhead. The chart did not change. The horizon did.
This is why the Academy covers Trading vs Investing before it goes deep into chart mechanics. Until you know which one you are doing, you cannot know which timeframe deserves your attention, or what a wrong reading would even look like. I have watched people turn a two day trade into a three year investment purely because the position went against them, and no chart told them to do that. An unwillingness to accept a loss did.
Decide the horizon first. Read the chart second.
Context that lives outside the candles
Charts do not float in a vacuum, and some of the strangest price action makes perfect sense once you know what was happening in the world at that hour.
Session timing is the big one. Index futures behave very differently in the quiet stretch before a cash open than in the first sixty minutes after it. Volatility clusters around openings, scheduled releases and closings, and a level that held all night can evaporate in the first two minutes of real volume.
Scheduled news matters even if you never trade it directly. Central bank decisions, inflation prints and earnings reports produce moves that ignore whatever elegant structure you spent an hour mapping. Checking the calendar takes thirty seconds and it is the cheapest mistake you will ever avoid.
Liquidity is the quieter factor. Holiday sessions, late Friday hours and thinly traded instruments produce charts that look normal and behave badly, with wider spreads, wilder wicks, and levels that break for no reason before reversing immediately.
Linear or logarithmic, a small setting with real consequences
On a linear scale, a move from ten to twenty covers the same vertical distance as a move from one hundred and ten to one hundred and twenty. On a logarithmic scale, equal percentage moves take up equal space.
For anything with a long history or a wide total range, crypto very much included, the logarithmic view tells a more honest story. Trend lines that look broken on one scale sit perfectly intact on the other. Flip between the two before you commit to a reading, because they disagree more often than you would expect.
Mistakes I see in almost every chart somebody sends me
People send me screenshots fairly often, and the same errors keep showing up. Most of them come from drawing after the fact, which is easy to do without noticing. Finding a line that touches four historical points is trivial once you already know where price went, and the only honest test is whether you drew it before the move happened.
Right behind that comes analysis with no invalidation. If your reading is that something “looks bullish”, there is no way to be wrong, which means there is nothing to learn from the outcome either. A real reading names the price at which the idea stops making sense, and it names it before the trade.
Then there is the habit of confusing a level with a guarantee. A level is a place where a reaction becomes more likely than it would be elsewhere on the chart, and that is the whole claim. Probability, not prophecy.
The quietest error is reading the chart of the thing you want to be true. Once you are long, every candle starts looking like accumulation, and no amount of technical study fixes that, because it is a psychology problem wearing a chart costume. Writing the reading down before you take the position helps more than anything else I have tried.
A reading routine you can repeat
I run roughly the same sequence every morning, and the order matters more than any individual step. I zoom out to the weekly first, purely to see where price sits relative to the last year, then move to the daily and mark two or three levels a reasonable person would also mark.
From there I go to the hourly and describe the current structure out loud in one sentence. Something like “higher lows since Tuesday, capped at last week’s high”. Saying it out loud sounds silly and it works, because a reading you cannot phrase simply is usually a reading you do not have.
After that I check the volume behaviour on the most recent move, glance at the economic calendar, and only then open the execution timeframe. The final step is writing down what would prove me wrong. If I cannot write it, I do not have a reading, I have a feeling.
The whole routine takes about six minutes per instrument once it settles into a habit. And it does settle, the way driving does, where the first twenty attempts feel like conscious effort and then one morning you notice you are already doing it.
Practising the reading before money gets involved
The distance between understanding a chart and reading one under pressure is enormous, and repetition is the only thing that closes it. The practice environment inside Xcelerate Trade earns its place in the learning path here, because market replay walks you through past sessions candle by candle without showing you what comes next.
That detail is the entire point. Scrolling back through history teaches you very little, since your brain has already seen the ending. Replay forces you to commit to a reading with the right side of the screen genuinely blank.
Pair replay with a journal and the improvement curve steepens fast. Screenshot the chart before you act, write your reading in two sentences, write your invalidation level, then come back a week later and compare what you saw with what happened.
Speaking from a folder full of embarrassing screenshots, your losing readings will share a pattern. Mine were almost always the sessions where I skipped the higher timeframe check because I was in a hurry. Yours will be something else, and the journal is the only way you will find it.
What changes once the chart stops feeling like noise
The strangest part of getting better at this is how undramatic it feels. There is no moment where the chart lights up and reveals anything. The screen simply gets quieter.
You stop seeing a wall of green and red and start seeing a sequence. Price came from down there, stalled here, buyers stepped in at this zone twice, volume dried up on the last push. The picture turns into a paragraph you can read at a glance, and most days that paragraph says nothing worth acting on, which is the point.
Good chart reading eliminates far more trades than it creates. That is the part I wish somebody had told me the day I opened my first chart and clicked buy on a feeling. The skill is not spotting opportunity everywhere, it is recognising the rare occasions when the chart says something clear enough to be worth your money, and having the patience to wait for them.
Frequently Asked Questions
Do I need to learn every candlestick pattern
No, and trying to will slow you down. Understand what the open, high, low and close represent, then learn to see rejection and dominance in a candle’s shape. A short list, engulfing candles and long wick rejections in particular, covers most of what the other patterns are describing in different words.
Which timeframe should a beginner start with
The daily chart, without much competition. It moves slowly enough for you to think, it filters out intraday noise, and one candle equals one decision point rather than three hundred. Once daily structure reads clearly, drop to the four hour and repeat the same exercise.
How do I know whether the market is trending or ranging
Look at the sequence of swing points rather than at the slope of the last few candles. Higher highs with higher lows is an uptrend, lower highs with lower lows is a downtrend, and anything that keeps turning around inside the same band is a range. If you cannot describe the sequence in one short sentence, treat it as a range and act accordingly.
Should support and resistance be drawn as lines or as zones
As zones, always. Orders cluster across a band of prices rather than at one exact number, so a support area forty points wide on an index is completely normal. Drawing a level as a precise line leads you to conclude the concept failed when price misses it by a fraction and reverses anyway.
How many indicators should I have on my chart
One or two, and each should answer a question you can state in a single sentence. Every indicator is calculated from price and volume, so it summarises information the chart already contains rather than adding anything new. Plenty of experienced readers run none at all and manage perfectly well.
Can chart reading predict the next move
It cannot, and anyone promising otherwise is selling something. A good reading gives you a probability assessment and, more usefully, the exact price at which you are wrong. The money is made by managing risk around that assessment, not by being right more often than everyone else.
Does volume matter as much on crypto and forex as it does on stocks
Less, and for structural reasons. Forex has no central exchange, so the volume you see comes from your broker or a feed rather than the whole market, and crypto volume varies in quality between venues. I still read it, only as supporting evidence rather than confirmation on its own.
How long does it take to read charts confidently
For most people a few months of consistent daily practice produces real fluency in reading structure and levels. Acting on that reading without hesitating takes considerably longer, because analysis and discipline develop on separate timelines. Replay sessions and a written journal shorten both, mostly by showing you which mistake you keep repeating.