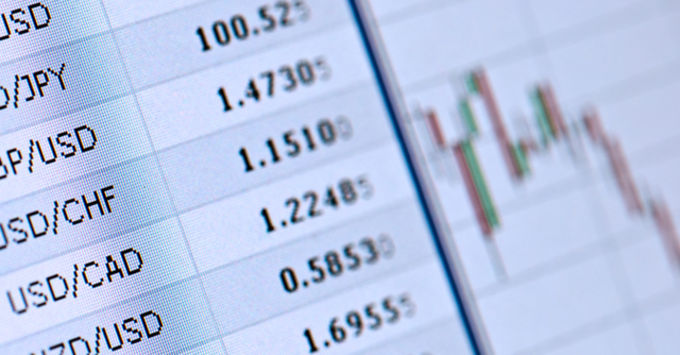

Put Bitcoin, EUR/USD and the Nasdaq 100 (quoted as US100 on most trading platforms) on one screen and run the same entry rule with identical settings on all three. On paper that’s one strategy. In the account it tends to behave like three unrelated bets, because the three markets share very little apart from the shape of their candles.
Yes, one strategy can work across crypto, forex and indices, but only its logic travels unchanged. The parts that touch the market directly, meaning stop distance, position size, session timing and available leverage, have to be recalibrated for each instrument. On Xcelerate Trade, the workable approach is one core strategy with market-specific settings, tested separately on every market.
The stop is the price at which a losing trade gets closed, and stop distance is how far it sits from the entry. Leverage is exposure borrowed from a broker, written as a ratio such as 30:1, so a small deposit can control a much larger position.
What carries over when you move a strategy between markets
The part of a strategy that carries over between crypto, forex and indices is its reasoning, meaning the reason behind an entry and the condition that tells you the idea has failed. Price in all three markets comes from an auction between buyers and sellers, so a break of structure, the moment price takes out the last swing high or low (the most recent local peak or bottom), means roughly the same thing on a Bitcoin chart as on the US100. Stop orders still cluster above old highs, and the opening of a major session still tends to bring a burst of activity. If an edge, meaning a repeatable statistical advantage, comes from how traders behave around obvious levels, that behavior shows up in every liquid market, because greed and impatience work the same way whatever the ticker.
Risk measured in R travels well too. R is the amount you agree to lose on a single trade, so if you risk 0.5% of the account and call that 1R, a 2R win on EUR/USD and a 2R win on Ethereum mean exactly the same thing for the account. That habit makes results comparable when the instruments themselves aren’t.
The idea and the parameters
I find it helps to split every strategy into two layers. The top layer is the idea, for example: after the opening range (the high and low of the first minutes of a session) forms, trade a confirmed break of that range once price comes back to retest the broken edge, in the direction of the higher timeframe trend. The bottom layer holds the parameters, such as stop distance, the session that defines the range, the entry timeframe and the position size.
The idea can be shared across markets, while the parameters almost never can. Copying them along with the idea is, in my view, where most cross-market strategies break down.
Why do crypto, forex and indices behave so differently?
The biggest difference between crypto, forex and indices is volatility, meaning how much prices move over a given period. Trading hours and liquidity differ as well, and each gap is enough on its own to break a strategy that was copied without adjustment.
Volatility is the first thing to break
CoinDesk’s calculations, published on October 23, 2026, put Bitcoin’s 90-day realized volatility at about 38%, against roughly 11% for the S&P 500 and 4.6% for EUR/USD. Realized volatility measures how much the price actually moved, expressed as an annual percentage. Bitcoin was moving about eight times as much as the most liquid currency pair and a little over three times as much as the main US stock index.
Now picture a stop placed 0.3% away from entry. On EUR/USD that might be a sensible buffer behind a swing low. On Bitcoin it’s noise, a distance price can cover in a few minutes on a quiet day, and a trader using it will get stopped out of trades that were right about direction.
The clock decides where a range starts
Crypto trades around the clock, seven days a week, with no opening bell. The currency market runs roughly 24 hours a day from Sunday evening to Friday evening New York time, while US stock indices have a cash session from 9:30 a.m. to 4 p.m. New York time, even if index CFDs and futures (exchange-traded contracts for a future date) quote for longer. A CFD, or contract for difference, is a derivative that tracks an asset’s price without the trader owning the asset.
An opening range on the US100 has a natural anchor in the cash open, when volume floods in, and on EUR/USD the London open does a similar job. Bitcoin has no such anchor, so one has to be chosen deliberately, and a weak choice quietly undermines the whole strategy.
Liquidity and who sits on the other side
Forex is the deepest of the three markets by a wide margin. The Bank for International Settlements found in its 2025 Triennial Survey that global foreign exchange turnover averaged $9.6 trillion a day in April 2025, up 28% from 2022.
That liquidity, meaning how easily large orders get filled without moving the price, keeps the spread on major pairs tight for most of the day. The spread is the gap between the buy and sell price, and it widens around big releases and around rollover, the daily moment near 5 p.m. New York time when open currency positions are carried to the next day.
Index CFDs sit in the middle, liquid during the cash session and noticeably thinner overnight. Crypto liquidity depends heavily on the exchange and the hour. Weekend order books can be thin enough to cause heavy slippage, the gap between the price a trader expects and the price actually filled.
Leverage rules change the math before you enter
Leverage limits change the math of a cross-market strategy because the same account can open very different position sizes on each market. For retail clients in the European Union, the European Securities and Markets Authority (ESMA) set caps in its 2018 product intervention at 30:1 for major currency pairs, 20:1 for major stock indices and gold, and 2:1 for cryptocurrencies.
ESMA’s temporary measure expired at the end of July 2019, once most national regulators had adopted permanent rules at least as strict, so the caps still shape what a European retail account can open. A strategy that looks fine on paper with 100:1 leverage may simply not fit inside 2:1 on Bitcoin. Better to find that out while planning than when a broker closes the position for lack of margin, the deposit that keeps a leveraged trade open.
Analyses by national regulators, cited by ESMA when it announced the measures, found that between 74% and 89% of retail CFD accounts typically lose money, with average losses per client between roughly €1,600 and €29,000. I keep that number in mind whenever one fixed lot size for every market starts to look like a simplification. A lot is the standard unit of position size in forex, and a standard lot equals 100,000 units of the base currency, the first currency in a pair such as EUR/USD.
Position size comes from the stop
Sizing from the stop means deciding your risk in money first, measuring the stop distance the chart actually requires, and only then calculating the position size. Leverage comes in at the very end, as a ceiling you check the position against.
Reversing that order, picking a lot size because it feels normal and squeezing the stop to fit, is how a strategy that behaves on forex can wreck an account on crypto. When that happens, converting every result into R usually shows that the entries were fine and that one market, the one with the largest real risk, carries most of the drawdown, meaning the fall from the account’s peak to its lowest point.
How I adapt one strategy to three markets on Xcelerate Trade
Adapting one strategy to three markets, the way I do it, means keeping the entry logic fixed and letting four settings change per market: the session anchor, the stop distance measured in ATR, the entry timeframe and the news filter. Risk per trade in R stays identical everywhere.
Xcelerate Trade is an online trading education platform, available in English and Romanian, that combines a structured Academy with rules-based strategies and TradingView indicators for crypto, forex, stocks and indices.
Anchor the session on purpose
Opening Range Breakout, or ORB, is a strategy that marks the opening range of a session and trades a break of it, and it’s the best example I know of a strategy that travels well once the clock is respected. The ORB Detector indicator on Xcelerate.Trade builds and locks the opening range for the Asia, London or New York session, which is exactly the decision each market requires.
For the US100 I anchor the range to the New York cash open, and for EUR/USD to London. For Bitcoin, New York is the session I’d test first, because US traders and US macro data tend to hit crypto in those hours. Testing should make the final call, since a session that looks logical on paper can still produce weak ranges on a given market.
Measure stops in ATR units
Average True Range, or ATR, is the average size of a bar’s range over a set number of bars, and it’s the closest thing to a universal ruler I’ve found. A stop of 40 points on the US100, 12 pips on EUR/USD and $900 on Bitcoin may look like three unrelated numbers, yet measured in ATR on the same timeframe they can be the same stop. A pip is the fourth decimal place on most currency pairs, the smallest standard price step.
My rule places the stop beyond the structural invalidation level, the price that proves the trade idea wrong, and never closer than one ATR on the entry timeframe. The wording stays the same on every chart I trade, and only the number of points it produces changes from day to day.
Timeframes need a second look
A 5-minute chart doesn’t carry the same information on every market, since five minutes on the US100 right after the cash open can hold more movement than an hour of EUR/USD in the Asian session. I keep the hierarchy the same, a higher timeframe for direction and a lower one for entries, and check per market whether the entry timeframe produces enough clean bars to read. If it doesn’t, I move one step up on that market only.
Different news, same gate
Every market has its own calendar of dangerous moments. Forex and indices react hardest to central bank decisions and US data such as payrolls and inflation, with indices also moving on earnings from their heaviest companies. Crypto adds its own surprises, from exchange incidents to sharp changes in funding, the periodic payment between long and short holders of perpetual futures (crypto futures with no expiry date).
I use one rule for all three markets, which is no new entries in the 15 minutes before and after a high-impact event on the calendar that market follows. The rule is shared, while the list of events behind it is built separately for each market.
A worked example with the same risk on three markets
The simplest way to see how one strategy changes across markets is to run the same risk through all three. Imagine a $10,000 account risking 0.5% per trade, so 1R equals $50, with the same ORB break-and-retest logic on each instrument. The prices below are round numbers chosen for illustration.
On EUR/USD, say the structural stop sits 12 pips away. With a standard lot worth roughly $10 per pip, $50 divided by $120 gives about 0.42 lots, around €42,000 of exposure, which at a rate of 1.16 comes close to $48,700 in notional value, the full market value of the position. At the 30:1 cap that needs roughly $1,600 of margin.
On the US100, imagine a CFD at 25,000 points worth $1 per point per contract, with a 40-point stop. Fifty dollars divided by 40 gives 1.25 contracts, a notional value of about $31,250 and roughly $1,560 of margin at 20:1. On Bitcoin at $75,000 with a $900 stop, you’d buy about 0.055 BTC, roughly $4,150 of exposure, and at 2:1 that position ties up a little over $2,000.
The calmest market, EUR/USD, produces the biggest notional position and the most volatile one the smallest, because the risk stays at $50 on every trade. The table puts the main differences side by side.
| Crypto (Bitcoin) | Forex (EUR/USD) | Indices (US100, S&P 500) | |
| Trading hours | 24 hours, 7 days a week | About 24 hours, Sunday evening to Friday evening, New York time | Cash session 9:30 a.m. to 4 p.m. New York time, CFDs quote longer |
| 90-day realized volatility, CoinDesk, Oct. 2026 | About 38% | 4.6% | About 11% (S&P 500) |
| EU retail leverage cap, ESMA | 2:1 | 30:1 for major pairs | 20:1 for major indices |
| Natural anchor for an opening range | None, chosen by testing | London open | New York cash open |
| News that tends to move it most | Exchange incidents, funding, US data | Central banks, payrolls, inflation | Earnings, inflation, central banks |
| Stop in the worked example | $900 | 12 pips | 40 points |
How do you know a strategy really travels?
A strategy really travels when it shows positive results on each market tested separately, with those results compared in R. Pooling all the trades into one average can hide a market where the strategy loses steadily behind two markets where it does well.
My own threshold is roughly 100 trades per market before I believe anything, first in a backtest and then in replay or demo. A backtest runs the rules over historical data. Replay steps through past charts bar by bar as if they were live, and a demo account trades live prices with virtual money. A sample of 30 trades can support almost any story a trader wants to hear.
Read expectancy before win rate
Expectancy is the average result per trade in R, wins and losses included, and win rate is the share of trades that end in profit. A strategy with a 40% win rate and an average winner of 2.5R comes out at plus 0.4R per trade, while one that wins 70% of the time with tiny winners and large losers can bleed slowly for months.
When comparing markets, I look at expectancy and maximum drawdown in R side by side. If crypto shows expectancy similar to forex but a drawdown twice as deep, I’d cut the size on crypto and keep collecting trades before deciding anything else.
Correlation can double your risk
Correlation is the tendency of two markets to move in the same direction at the same time, and it can make one strategy on three markets riskier than it looks. In my reading of the charts, Bitcoin and the US100 have often reacted to the same macro headlines in the same direction, so a long signal on both is closer to one bigger bet than to two separate ones.
I handle this with a cap on total open risk, usually 1.5R across all positions at once. If the US100 and Bitcoin both trigger in the same hour, the second trade gets half size or gets skipped.
When should one strategy stay off a market?
One strategy should stay off a market when that market’s current regime, meaning its prevailing character of trending or ranging, contradicts the idea behind the strategy. A breakout strategy needs markets that keep going after the break, while a mean reversion strategy, one that bets on price returning toward an average, needs markets that snap back. The same instrument can switch between those two moods for weeks at a time.
My view is that major currency pairs spend long periods ranging, especially between big data releases, while crypto tends to trend harder once it gets moving. Indices sit somewhere between the two and depend a lot on earnings season. When a strategy struggles on one market, my first question is whether the current regime suits the idea at all.
The clearest warning sign is expectancy that stays negative after a decent sample. A quieter one is breaking your own rules far more often on one market, which usually means the trader doesn’t trust the strategy there.
Where funded accounts fit into a multi-market strategy
Funded accounts fit into a multi-market strategy as a later step, once the strategy has proven itself on each market under rules as strict as a prop firm’s. A proprietary trading firm, or prop firm, lets traders use its capital after an evaluation, a paid test with a profit target and loss limits. Conditions such as a maximum daily loss and an overall drawdown limit then apply to all markets at once.
A rule against holding positions over the weekend hits crypto traders differently than index traders, and a ban on trading around news can remove a large share of the opportunities in a forex strategy built on data releases.
Before paying for any evaluation, I’d read the Xcelerate.Trade playbook on How to Trade with a Company’s Capital, which walks through how evaluations work and the limits firms typically set. Its most practical advice is to simulate the firm’s exact rules on a demo account before spending money on an attempt.
Drawdown limits are often expressed as a percentage of the account, which turns losing streaks into arithmetic. A worst streak of 8R costs 4% of the account at 0.5% risk per trade and 8% at 1%, so the same strategy can sit comfortably inside a limit or brush against it depending only on size. That calculation belongs in the plan for each market before the evaluation starts.
What a sensible first month looks like with three markets
A sensible first month with one strategy and three markets starts with only one of them. I’d pick the market whose hours fit your real schedule, write the full rule set for it, and run it in replay or demo until the rules feel automatic.
The second market comes in only after the first has a few dozen logged trades, and the third later still. Each new market gets its own page in the trading journal, its own session anchor, its own ATR-based stop and its own news list, while the entry logic stays word for word identical.
On Xcelerate.Trade, the Academy and the free strategy playbooks are a reasonable place to build the shared logic, and indicators such as the ORB Detector or the market structure tools help apply it the same way on each chart. The decisions about session anchor, stop and size still have to come from your own testing.
Frequently asked questions
Does a strategy that works on EUR/USD also work on other currency pairs?
A strategy that works on EUR/USD doesn’t automatically work on other currency pairs, because other pairs can move more and often carry wider spreads, the gap between buy and sell prices. The entry logic can stay the same, while stop distance and position size need recalculating for each pair. Each pair also deserves its own sample of trades before the results are trusted.
Should weekend Bitcoin data go into a backtest?
Weekend Bitcoin data belongs in a backtest only if the strategy will actually trade on weekends. Weekend order books are often thinner, which can mean larger slippage, so mixing weekdays and weekends can make a weekday-only strategy look better or worse than it really is.
Is gold closer to forex or to indices for this kind of strategy?
Gold sits between the two. It is quoted against the US dollar like a currency pair and trades almost around the clock on weekdays, yet for EU retail clients ESMA placed it with major indices at a 20:1 leverage cap. That grouping is a practical starting point for sizing gold trades inside a multi-market strategy.
How do you convert pips, points and dollars into R?
Pips, points and dollars convert into R by dividing the profit or loss of a trade by the amount risked on it. A trade that risked $50 and made $125 returned 2.5R, whether the move was measured in pips on EUR/USD, points on the US100 or dollars on Bitcoin. Recording every trade this way makes results from different markets directly comparable.
Do prop firms allow crypto trading on funded accounts?
Some prop firms allow crypto trading on funded accounts and others don’t, and those that allow it may attach extra conditions, such as lower leverage or limits on weekend holds. The rules differ from firm to firm and change over time, so the current official terms of the specific firm are the only reliable answer.